

The Chart Showed a Breakout. You Were Providing Liquidity.
Discretionary trading makes it dangerously easy to get lost in flickering candles: a big green bar above a moving average triggers FOMO; a long lower wick looks like iron-clad proof.
Discretionary trading makes it dangerously easy to get lost in flickering candles: a big green bar above a moving average triggers FOMO; a long lower wick looks like iron-clad proof.
Why pure “chart reading” fails
The human brain is a powerful pattern-recognition machine. In prehistoric times, it helped us spot a tiger in the rustling grass. In modern markets, it mostly produces severe confirmation bias.
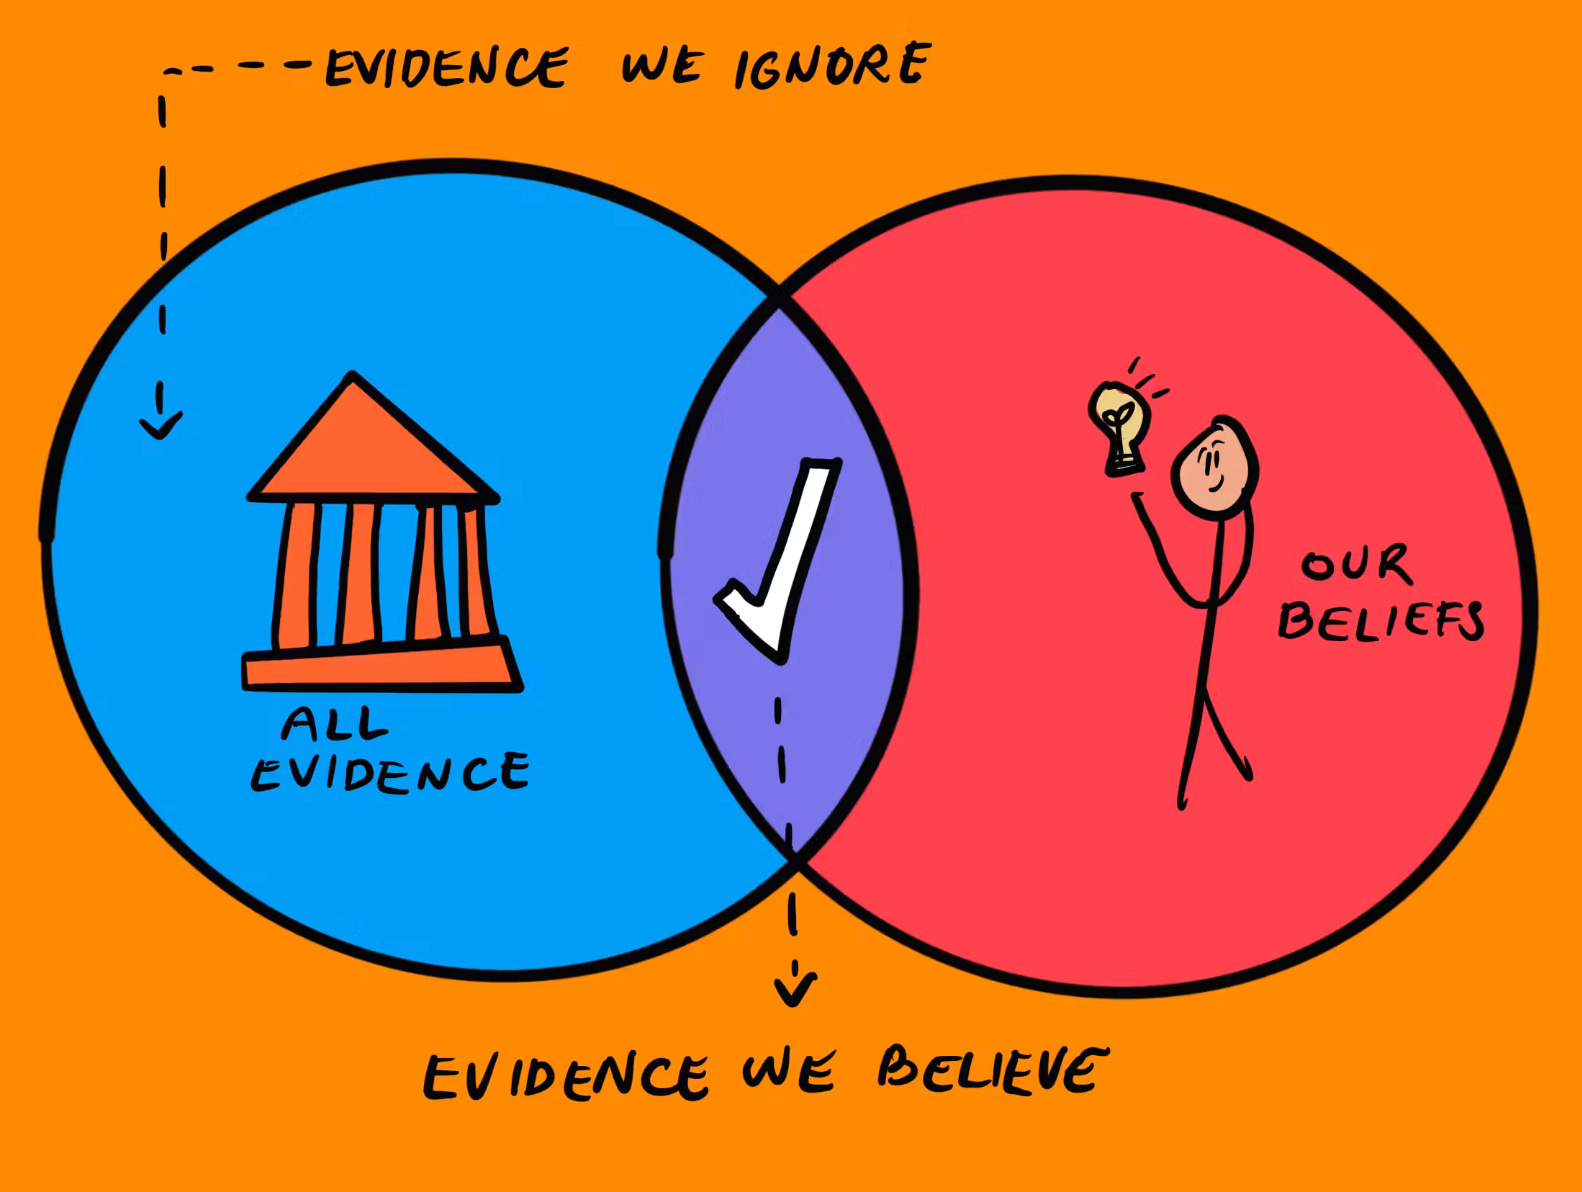
When you’ve already decided the market is going up, your eyes automatically filter out bearish signals and see only the “inverse head-and-shoulders” or the “oversold RSI.” Worse: patterns on a technical chart usually lack any underlying cause-and-effect relationship.
Real example: you see a stock “break above its previous high,” so you pile in heavy. That breakout may simply be a large passive index fund doing quarterly rebalancing, not a fundamental turnaround. Once the fund finishes building, buying pressure evaporates, price snaps back, and you’re left holding a bull trap. Trade purely by the chart and you usually end up as a liquidity provider.
So if you don’t follow the chart, what do you follow?
Cause and effect before the first line of code
Before the first line of Python is written, a quality quant strategy must be explainable in one simple sentence of economic intuition. Charts and data are merely tools for validating that logic.
Take my Macro-Rotational Portfolio. We have a sleeve dedicated to a copper miners ETF (COPX). The signal that decides whether to buy copper miners is not whether copper breaks above its 200-day moving average. Instead, we watch semiconductors (SMH) relative to broad tech (XLK).
The economic logic is straightforward:
- A leading indicator of capital expenditure: Semiconductors are the foundation of modern tech hardware. When semis strongly outperform broad tech, it usually means the real economy is expanding, AI infrastructure demand is exploding, and corporate capex is entering a genuine upcycle.
- Hard demand for commodities: That hardware buildout consumes enormous quantities of base industrial metals. Copper is famously “Dr. Copper, PhD in macroeconomics”: the mother of all industrial metals.
- Theme rotation and valuation spillover: Semiconductor strength leads demand expectations for upstream copper mining resources. Equity capital typically chases hot semiconductor names first; once valuations stretch to the limit, smart money moves down the supply chain in search of valuation troughs, and upstream resource stocks catch the spillover.
When we translate this logic into code (monitoring the 10-day percentile rank of the Semi-Tech Log-Spread Indicator), what we capture is capital flow transmitted up and down the industry chain. That is far more robust than staring at a MACD crossover on COPX.
Logic settled. Next problem: will a human still press the button in a crash?
A mathematical engine that removes emotion
Once the trading logic is settled, the rest goes to the mathematical engine. The other enormous advantage of quantitative trading is absolute consistency of execution.
During the COVID crash of March 2020, or the inflation bear market of 2022, discretionary traders stared at the flood of bad news and collapsing candles and, paralyzed by panic, couldn’t press buy. Even when a breakout occurred, they took profits early because “it feels like it’s gone up too much.”
A quant system has no fear and no greed. As long as the relative strength of the Semi-Tech Log-Spread Indicator hits 95 and no macro circuit breaker (such as a VIX inversion) has been triggered, the system executes the buy. Likewise, when conditions aren’t met, the system sits in cash, even if the broad market is going to the moon.
The market doesn’t care about your trend line
The market doesn’t care about your trend lines, and it doesn’t care how perfect a pattern looks. It only cares about capital flows, liquidity conditions, and the relative value between assets.
Build a system that tracks the underlying economic logic, and encode the cause-and-effect relationships into immutable code. When you stop staring at the twitching of candlesticks and start watching the data that drives them, the profits follow naturally.
Source: The Essence of Quantitative Trading: Trade the Logic, Not the Chart