
Your Backtest Looks Perfect. That’s Exactly Why You Shouldn’t Trust It.
Most strategies don’t die in live markets because the idea was stupid. They die because the backtest was a flattering mirror — and nobody checked whether the reflection survived contact with the future.
Most strategies don’t die in live markets because the idea was stupid. They die because the backtest was a flattering mirror — and nobody checked whether the reflection survived contact with the future.
The Trap Almost Every Retail Quant Falls Into
Here’s the quiet confession of retail quant culture: take ten years of data, hunt for the “best” parameters, then tell yourself those parameters will work tomorrow because they worked yesterday. It feels rigorous. It is self-deception with a spreadsheet.
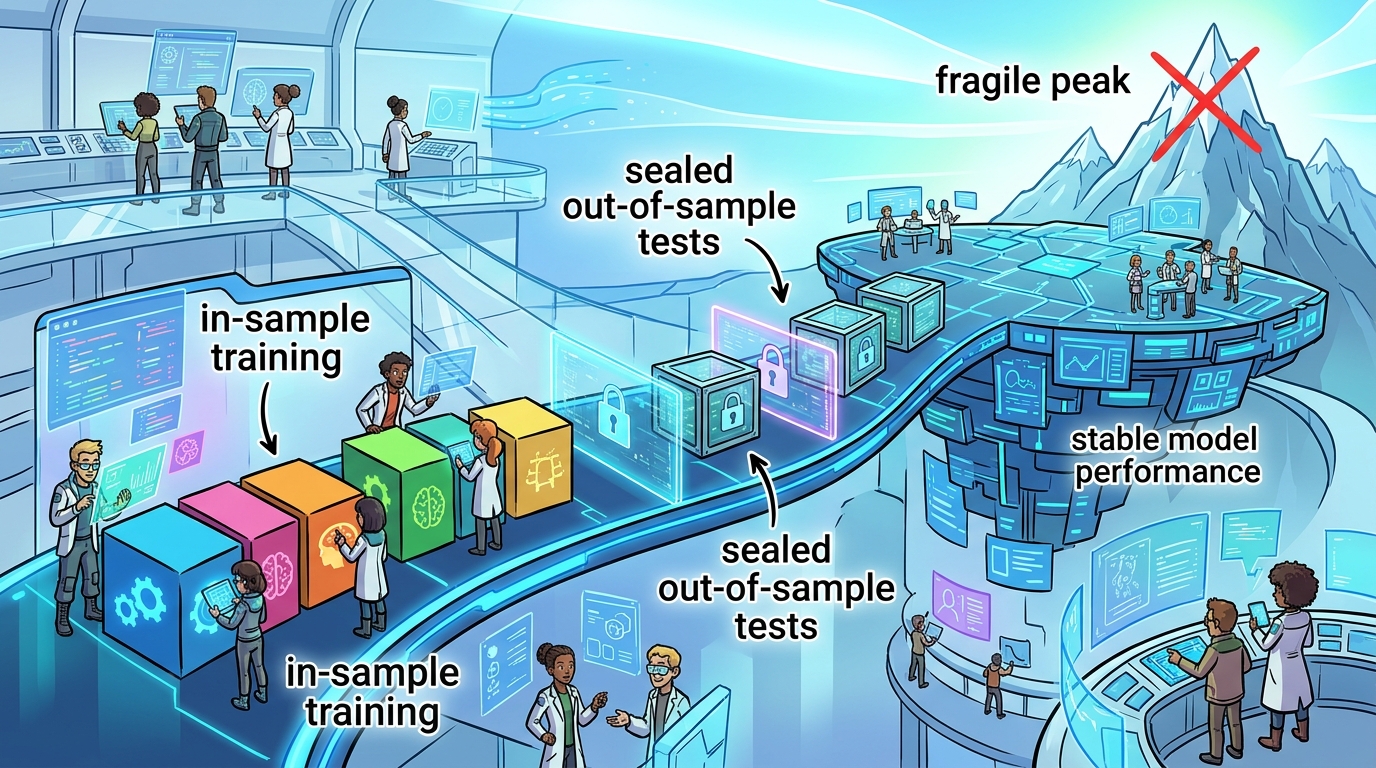
There is a harsher way to ask the same question. Cut history into adjacent, strictly non-overlapping windows. Give the model two years (about 504 trading days) to train — In-Sample (IS) — and let it search for parameters that fit that macro regime, say whether a VIX-inversion trigger should fire at 10 or at 25. Then freeze those parameters absolutely. March them into the next half year (about 126 trading days) — Out-of-Sample (OOS) — a blind zone the model is forbidden to peek into. Record the real OOS return. Roll the timeline forward six months. Repeat.
Stitch those dozen-plus half-year OOS equity curves into one seamless series. That stitched curve is the strategy’s most honest estimate of future performance — watered-down-free. If a strategy looks heroic in training and collapses the moment it meets unseen data, this process eliminates it without mercy. That process is Walk-Forward Optimization (WFO). Once you’ve seen it, full-sample optimization never looks innocent again.
Don’t Celebrate the Peak. Hunt the Plateau.
Returns matter. Parameter stability matters more — and most people never look.
Imagine a VIX-inversion setting that prints a fortune at 15 and bleeds at 14 or 16. Mathematically, that is a fragile parameter peak. Nudge the market an inch and the edge vanishes. What we hunt for is a parameter plateau: steadily profitable whether the setting is 10, 15, or 20. Only a broad plateau survives the unknown noise of future live markets. Peaks look brilliant in a slide deck. Plateaus pay the rent.
Two Sleeves. One Mirror. Opposite Verdicts.
Want to know whether a “perfect” backtest is real alpha or a costume fitted to one stretch of history? Put it in front of a merciless mirror and watch what happens.
From our MainProfoilo overfit battery (overfit_check_10leg.txt), we freeze the model on In-Sample data through 2023-12-31, then walk it into Out-of-Sample from 2024-01-01 onward. Same split. Two sleeves. Opposite verdicts.
Why XRT failed. The sleeve trades retail via ln(XLY/XLP). On the IS tape it looked fine — Sharpe 0.91, the kind of number that tempts you to allocate real capital. Push it into OOS and the edge decays: Sharpe falls to 0.52 (Δ −0.39), return thins to +22.9%, drawdown deepens to −24.1%. The training window flattered a pattern that did not generalize. That is overfitting: the model memorized a stretch of history instead of learning a rule that still works when the calendar rolls forward. We cut it from the portfolio.
Why XOP survived. Same mirror, opposite story — oil & gas via ln(IWM/SPY). IS Sharpe was only 0.79, nothing flashy. OOS it jumped to 2.12 (Δ +1.33), with +226.6% return and a milder −15.5% max drawdown. The signal did not need the training years to look heroic; it kept paying on data it never saw. That is what non-overfit looks like: modest in-sample, still alive out-of-sample. We kept it.
Separately, mounting Ln(VIXM/VIXY) < 25 as a Vol Contango blocker on the IWM_XOP sleeve — under rolling WFO — lifted Sharpe from 0.83 to 0.94 and compressed max drawdown from −59.2% to −46.6%, including the 2018 selloff and 2020 pandemic windows.
Weight-picking was also an overfit
At portfolio level the same mirror spoke again. Optimized 10-leg weights printed OOS Sharpe 2.58 (max drawdown −7.3%). Plain equal-weight — 10 × 10% — printed 2.77 with a milder −6.8% drawdown. The optimizer overweighted what looked strong in-sample and underweighted what actually worked later (USO, LIT). Chasing the IS peak allocation lost to boring 1/N. That is what non-overfit looks like at portfolio level: refuse the fragile peak.
What You’re Really Buying Is Sleep
The drawdown isn’t what keeps a quant awake at night. Not knowing whether the drawdown is normal — or whether the model already broke — is.
WFO is tedious and computationally heavy. It will smash that beautiful 45-degree full-sample curve to pieces. That smash is the point. Every parameter written into live code has already survived a brutal test against future markets it never saw — universal logic, not self-deception fitted to history’s random noise. That is the price of sleeping through the next storm. That is the power of science.